
ERCOT, the Electric Reliability Council of Texas, operates the most volatile wholesale power market in the United States. No other ISO combines a largely isolated grid, an energy-only market design, extreme weather exposure, and a rapidly evolving resource mix quite like Texas. The result is a market where prices can swing from negative dollars to $5,000/MWh within the same day, and where a handful of extreme hours can account for a disproportionate share of annual merchant revenue.
For developers, traders, corporate strategists, originators, project finance teams, and investors with ERCOT exposure, understanding price spike mechanics is not optional. It is the core of valuation and risk management.
ERCOT’s Unique Market Design: Why It Creates Extreme Prices
Energy-Only Market
Unlike PJM, ISO-NE, NYISO, SPP, and MISO, ERCOT does not have a capacity market. There is no forward capacity auction that pays generators for being available. Instead, ERCOT relies on the energy market to provide the price signals needed to attract and retain sufficient generation. In theory, this means that when the system is tight, prices must rise high enough to cover the fixed costs of new capacity, or capacity exits the market until prices are high enough.
This design concentrates the value of flexibility into scarcity hours. A gas peaker in ERCOT that runs 300 hours a year may earn 60 to 80% of its annual revenue in 20 to 30 extreme hours. This is intentional by design, but it creates highly asymmetric revenue distributions that are difficult to finance with standard project finance assumptions. This is the fundamental difference between ERCOT merchant exposure and the contracted revenue available in other markets.
Isolation from the Eastern and Western Interconnections
ERCOT operates on its own synchronous grid, connected to neighboring grids only through a small number of DC ties with limited capacity (less than 1,000 MW of net import capability). When ERCOT’s grid tightens, it cannot import significant power from neighboring states. There is no relief valve. This structural isolation amplifies the price impact of supply shortfalls and directly affects ERCOT resource adequacy assessments.
The Operating Reserve Demand Curve (ORDC)
ERCOT uses a unique scarcity pricing mechanism called the Operating Reserve Demand Curve (ORDC) to translate reserve shortfalls into real-time price adders. As available operating reserves decline below target levels, the ORDC adds an increasing adder, measured in $/MWh, on top of the energy clearing price.
The ORDC adder is calculated at every real-time interval (5 minutes) and is designed to reflect the value of reliability: as reserves approach zero, the probability of load shedding (blackouts) increases, and the adder rises toward the Value of Lost Load (VOLL), which ERCOT sets at $5,000/MWh. The maximum real-time price in ERCOT (Systemwide Offer Cap) is $5,000/MWh.
Historical ERCOT Price Spikes: A Catalog of Extreme Events
Winter Storm Uri (February 2021)
Winter Storm Uri is the defining event in ERCOT’s history and one of the most significant grid reliability failures in US power market history. Over a period of roughly five days (February 10 to 16, 2021), unprecedented cold across Texas caused:
- Generation failures across all fuel types: approximately 30 to 35 GW of generating capacity tripped offline, far exceeding estimates. While media focus centered on wind turbines, the primary drivers of the outage were natural gas supply chain failures (frozen wellheads, pipes, and equipment) and outages of natural gas, coal, and nuclear plants that were not weatherized for extreme cold.
- Load shedding (rolling blackouts): ERCOT initiated controlled load shedding to prevent a total grid collapse. At the peak, approximately 4.5 million customers lost power, some for multiple days in freezing temperatures.
- Sustained high prices: ERCOT administered prices at or near the $9,000/MWh cap for multiple days, an unprecedented sustained high-price event. Wholesale electricity prices during the event totaled more than $50 billion across the market over approximately one week.
Uri is a reminder that ERCOT’s energy-only design is theoretically sound but depends on generators being prepared for tail risks. The event drove major policy responses, including Texas Senate Bill 3, which mandated weatherization standards for generators and fuel suppliers, though compliance and enforcement have been subjects of ongoing scrutiny.
Summer Heat Events: 2011, 2019, 2022, 2023
Texas summers routinely break demand records, and ERCOT has experienced multiple significant heat-driven scarcity events:
- August 2011: a record-setting summer heat wave pushed ERCOT to a then-record peak demand of 68.3 GW and produced multiple scarcity pricing episodes. Reserve margins were critically thin. The concept of the Planning Reserve Margin (PRM) became a focal point of market discussions following this event.
- August 2019: tight reserve margins during a mid-summer heat wave led to multiple emergency alerts and scarcity pricing hours, though load shedding was avoided.
- Summer 2022: following Uri, the first full summer with new weatherization requirements saw continued tightness. Multiple days in June and July triggered ERCOT’s Energy Emergency Alert (EEA), with prices at or near the cap for multiple hours.
- Summer 2023: ERCOT set a new all-time demand record in June 2023 at over 85.5 GW, as electrification, data center load growth, and heat combined. Despite tight conditions, the market performed without major outages, a testament to both new generation additions and demand response activation, though real-time prices spiked sharply during the peak hours.
Winter Storm Elliott (December 2022)
A second major winter event, Winter Storm Elliott, hit ERCOT in December 2022. While far less severe than Uri (the weatherization measures helped), approximately 3 to 5 GW of generation tripped offline during the extreme cold snap. ERCOT entered emergency conditions and prices spiked, though the event was contained without large-scale load shedding. It demonstrated that cold weather risk in Texas is real and recurring, not a once-in-a-century outlier.
The Mechanics of an ERCOT Price Spike
To understand ERCOT price risk, it helps to trace the sequence of events during a typical scarcity episode:
- Demand surges (heat wave, cold snap) or supply unexpectedly falls (generator trips, fuel supply issue).
- ERCOT’s real-time dispatch exhausts available economic offers. The system begins relying on expensive fast-start peakers and demand response.
- Operating reserves fall below the ORDC threshold (typically 2,000 to 3,000 MW). The ORDC adder begins rising.
- As reserves dwindle further, the ORDC adder increases steeply, pushing the effective settlement price toward $5,000/MWh even if generators have not offered there.
- ERCOT issues Emergency Notices and Energy Emergency Alerts (EEA) to activate emergency demand response and interruptible loads.
- If reserves recover, the ORDC adder falls. If they do not, ERCOT may resort to controlled load shedding to prevent a systemic collapse.
The speed of this sequence can be remarkable. An ERCOT summer afternoon can move from normal operations to $5,000/MWh conditions in 30 to 60 minutes when a large generator unexpectedly trips during a heat wave.
ERCOT Price Spike Distribution: Long Tails and Merchant Revenue
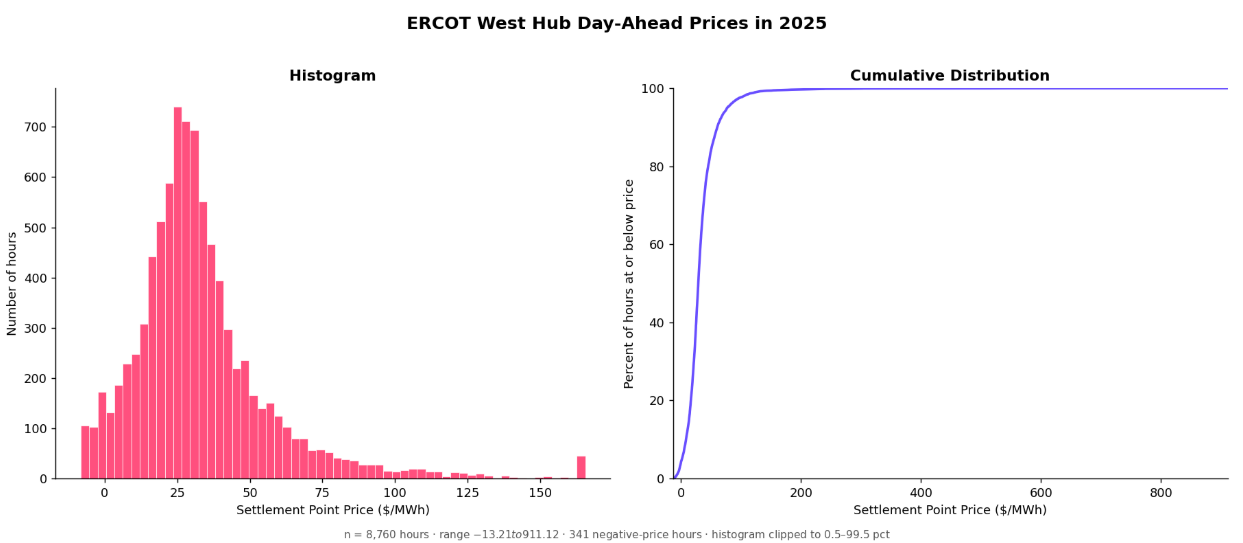
ERCOT’s price distribution has famously long tails. In a typical year, the vast majority of hours clear between $20 and $80/MWh. But the distribution does not follow a normal bell curve: extreme high-price hours occur far more frequently than a normal distribution would predict.
This creates the merchant revenue structure that defines ERCOT peaker economics:
- A simple-cycle gas peaker running only in hours above $100/MWh might run 500 to 1,000 hours in an average year.
- In a scarcity event year (Uri scale), those same units running at $5,000/MWh for 100+ hours can earn more than their entire capital cost in a single week.
- In a mild year with low demand, no extreme weather, and abundant supply from new renewable additions, peaker revenues can fall dramatically below the long-run cost of new entry, raising questions about merchant viability without scarcity events.
This asymmetry is the core tension in ERCOT merchant modeling: the expected value of peaker revenues is theoretically sufficient (by market design) to cover fixed costs, but the variance is enormous, and revenue concentration in tail events makes financing assumptions difficult. Noreva’s generation asset valuation tools model this scarcity revenue distribution explicitly, enabling stress-testing across weather and outage scenarios rather than relying solely on base-case assumptions.
The Evolving ERCOT Resource Mix and Its Price Implications
Wind Dominance
Texas has more installed wind capacity than any other state, over 40 GW. Wind is critical for keeping average wholesale prices low, but it also introduces correlation risk: wind output often falls during summer heat events (when prices are highest) and can be vulnerable to icing during winter cold snaps. The simultaneous loss of wind and thermal generation during Uri was not a coincidence: extreme cold affects both.
Solar Surge
Utility-scale solar installations in ERCOT have grown exponentially, from under 1 GW in 2018 to over 20 GW by 2024. Solar helps with summer afternoon peaks, but like California, ERCOT is beginning to see mid-day price suppression during high-solar, low-demand periods. The duck curve has arrived in Texas too, though the summer peak hours (late afternoon and evening) still see significant value.
Battery Storage Growth
ERCOT has become one of the most active markets for battery storage in the world, driven by the arbitrage opportunity between negative prices (increasingly common during midday solar oversupply) and scarcity price hours. Over 5 GW of battery storage was operational by early 2024, and over 14 GW by July 2026, with many more GW in the interconnection queue. The battery standards reshaping capacity dynamics article explores how these trends are playing out across multiple US markets.
Load Growth from Data Centers and Industry
Texas has become a major destination for data centers, cryptocurrency mining, and industrial manufacturing. The combination of deregulated markets, low average wholesale prices, and abundant land has attracted large new loads. ERCOT’s load growth projections have repeatedly been revised upward, a bullish signal for future scarcity events if data center and industrial development outpaces new generation.
What to Expect in 2026: ERCOT Price Outlook
Continued Load Growth
ERCOT’s own projections anticipate strong load growth continuing in 2026 and beyond, driven by data center demand and industrial expansion. Higher peak demand raises the probability of reserve margin compression during weather events and raises the expected frequency and severity of scarcity pricing episodes. Monitoring the planning reserve margin trajectory is essential for forward revenue analysis.
New Generation vs. Load Growth Race
Whether new solar, wind, and storage additions can keep pace with load growth will determine reserve margins in 2026 and beyond. Tight reserve margins increase the probability and severity of price spikes. The forward reserve margin trajectory is closely watched by market participants and directly influences ERCOT resource adequacy assessments.
ORDC Reform Considerations
ERCOT and the Public Utility Commission of Texas (PUCT) periodically revisit the ORDC parameters and the Value of Lost Load assumption. Changes to the $5,000/MWh price cap, the VOLL, or the reserve demand curve shape would directly affect scarcity pricing dynamics. Market participants should track PUCT dockets on market design reform. These issues are covered in depth in Noreva’s ongoing power market views.
Natural Gas Infrastructure Reliability
The Uri event demonstrated that natural gas supply chain failures are the primary driver of winter reliability risk in Texas. Ongoing weatherization requirements and fuel supply security initiatives will affect how thermal generators perform during future cold weather events, a key uncertainty for winter price spike probability.
Implications for ERCOT Asset Valuation
For any merchant asset in ERCOT, the following framework applies:
- Revenue is asymmetric and event-driven. Value renewables, peakers, and dispatchable assets on their expected capture of scarcity hours, not their average energy revenue.
- Stress-test for Uri-scale events. Even a 1-in-10 or 1-in-20 year event should be modeled explicitly in sensitivity analysis.
- Model cannibalization for solar. The ERCOT duck curve has arrived. Mid-day price suppression is a growing risk for solar assets with no storage. This is addressed in detail in our guide on renewable asset valuation.
- Watch the reserve margin trajectory. ERCOT’s PRM target and actual projected reserve margins are publicly available. Deviations from the target raise or lower scarcity event probability.
- Monitor PUCT and ERCOT market design changes. Texas’s political environment means market rules can shift meaningfully: the ORDC design, price cap, and ancillary service procurement have all evolved since Uri. Follow the latest analysis in our power market views.
Key Takeaways
- ERCOT is an energy-only market with no capacity mechanism. All fixed-cost recovery comes from energy and ancillary service revenues, concentrated in scarcity hours.
- The ORDC is the primary scarcity pricing mechanism: it adds a real-time adder to energy prices as reserves fall, pushing prices toward the $5,000/MWh cap.
- Winter Storm Uri (February 2021) was the defining extreme event, driven primarily by gas supply chain failures, not just wind outages.
- Summer heat waves (2011, 2019, 2022, 2023) and winter storms (Uri 2021, Elliott 2022) represent recurring, structurally driven risks, not anomalies.
- Load growth from data centers and industry is pushing ERCOT resource adequacy tighter through the mid-2020s, a bullish indicator for scarcity event frequency.
- 2026 ERCOT price risk is shaped by load growth, the generation development pipeline, ORDC parameters, and weather.